Costs to Provide Parking
How do we determine the cost of parking?
As an auxiliary enterprise, Parking and Transportation Services (PTS) does not receive any state funding. We must charge users in order to pay for parking garages and lots, shuttle service and Federal and State mandated alternative transportation activities. It will cost about $13 million this fiscal year to provide these services to the campus community. We set our rates in compliance with University policy to cover only the cost of operating the department, including infrastructure improvements such as new lots and garages.
Where does the money come from?
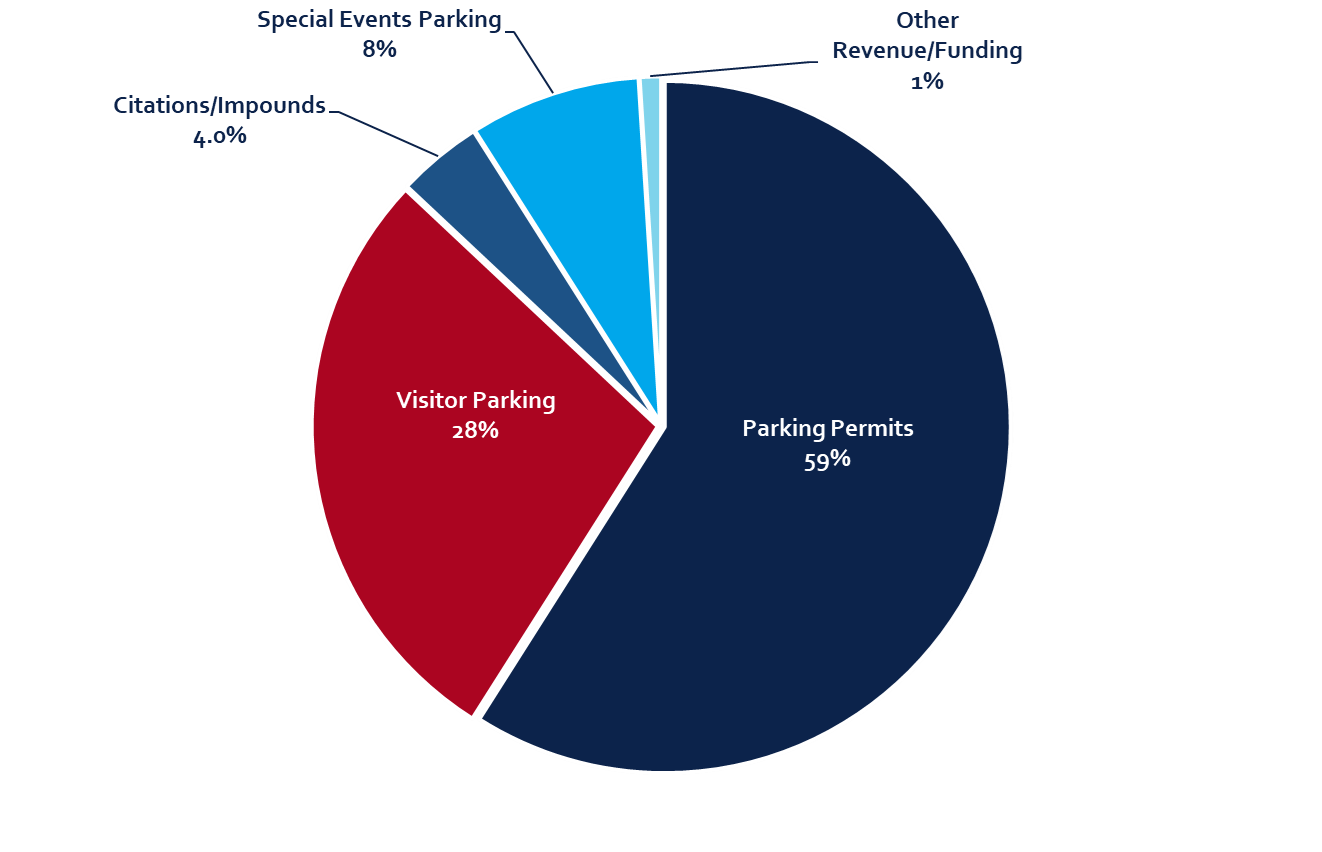
The majority of the funding, approximately 85%, is generated from permits and visitor revenue in parking garages and lots. Metered spaces, special events parking activity and shuttle charter activity contribute about 9 % and about 4% of our funding comes from parking citations.

How do we spend the money we collect?
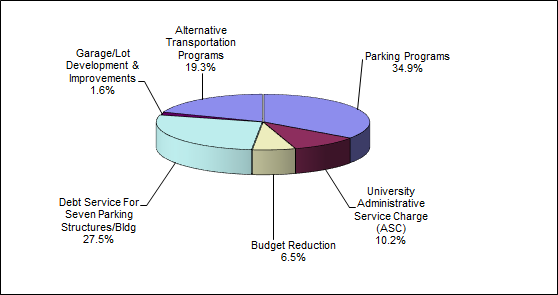
Parking Programs which makes up 35% is made up of salaries & wages, employee related expense (ERE), operations, travel and equipment expense used to manage the cost and revenue centers.

Who pays for the Cat Tran shuttle and other free services?
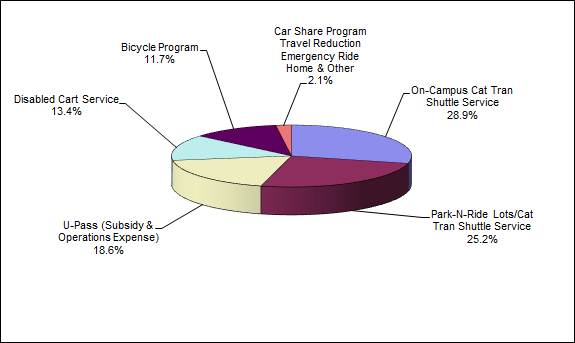
The on-campus Cat Tran shuttle, disabled cart service and emergency ride home programs are provided at no charge to the users of these services. In addition, to help ease the lack of parking on campus, Parking and Transportation Services subsidizes low cost park-n-ride lots and U-passes which allow unlimited rides on all Sun Tran buses and the Streetcar for students and employees. These activities are budgeted at $3.5 million this fiscal year and require a subsidy of $3.4 million. The services that pay for these programs include surface lot permits (56%), special events activity (16%), metered parking spaces (10%) and parking garages (18%).
Alternative Transportation Expense by Program

* Information excludes University Administrative Service Charges, ASC reported separately.
For detailed budget information please click here
